BU Dashboard — Smart, customizable classroom insights & learning progress
Transforming a static K–5 portal into a modular, insight-driven workspace used by 120,000+ North American teachers to manage literacy instruction, assessments, and daily interventions.
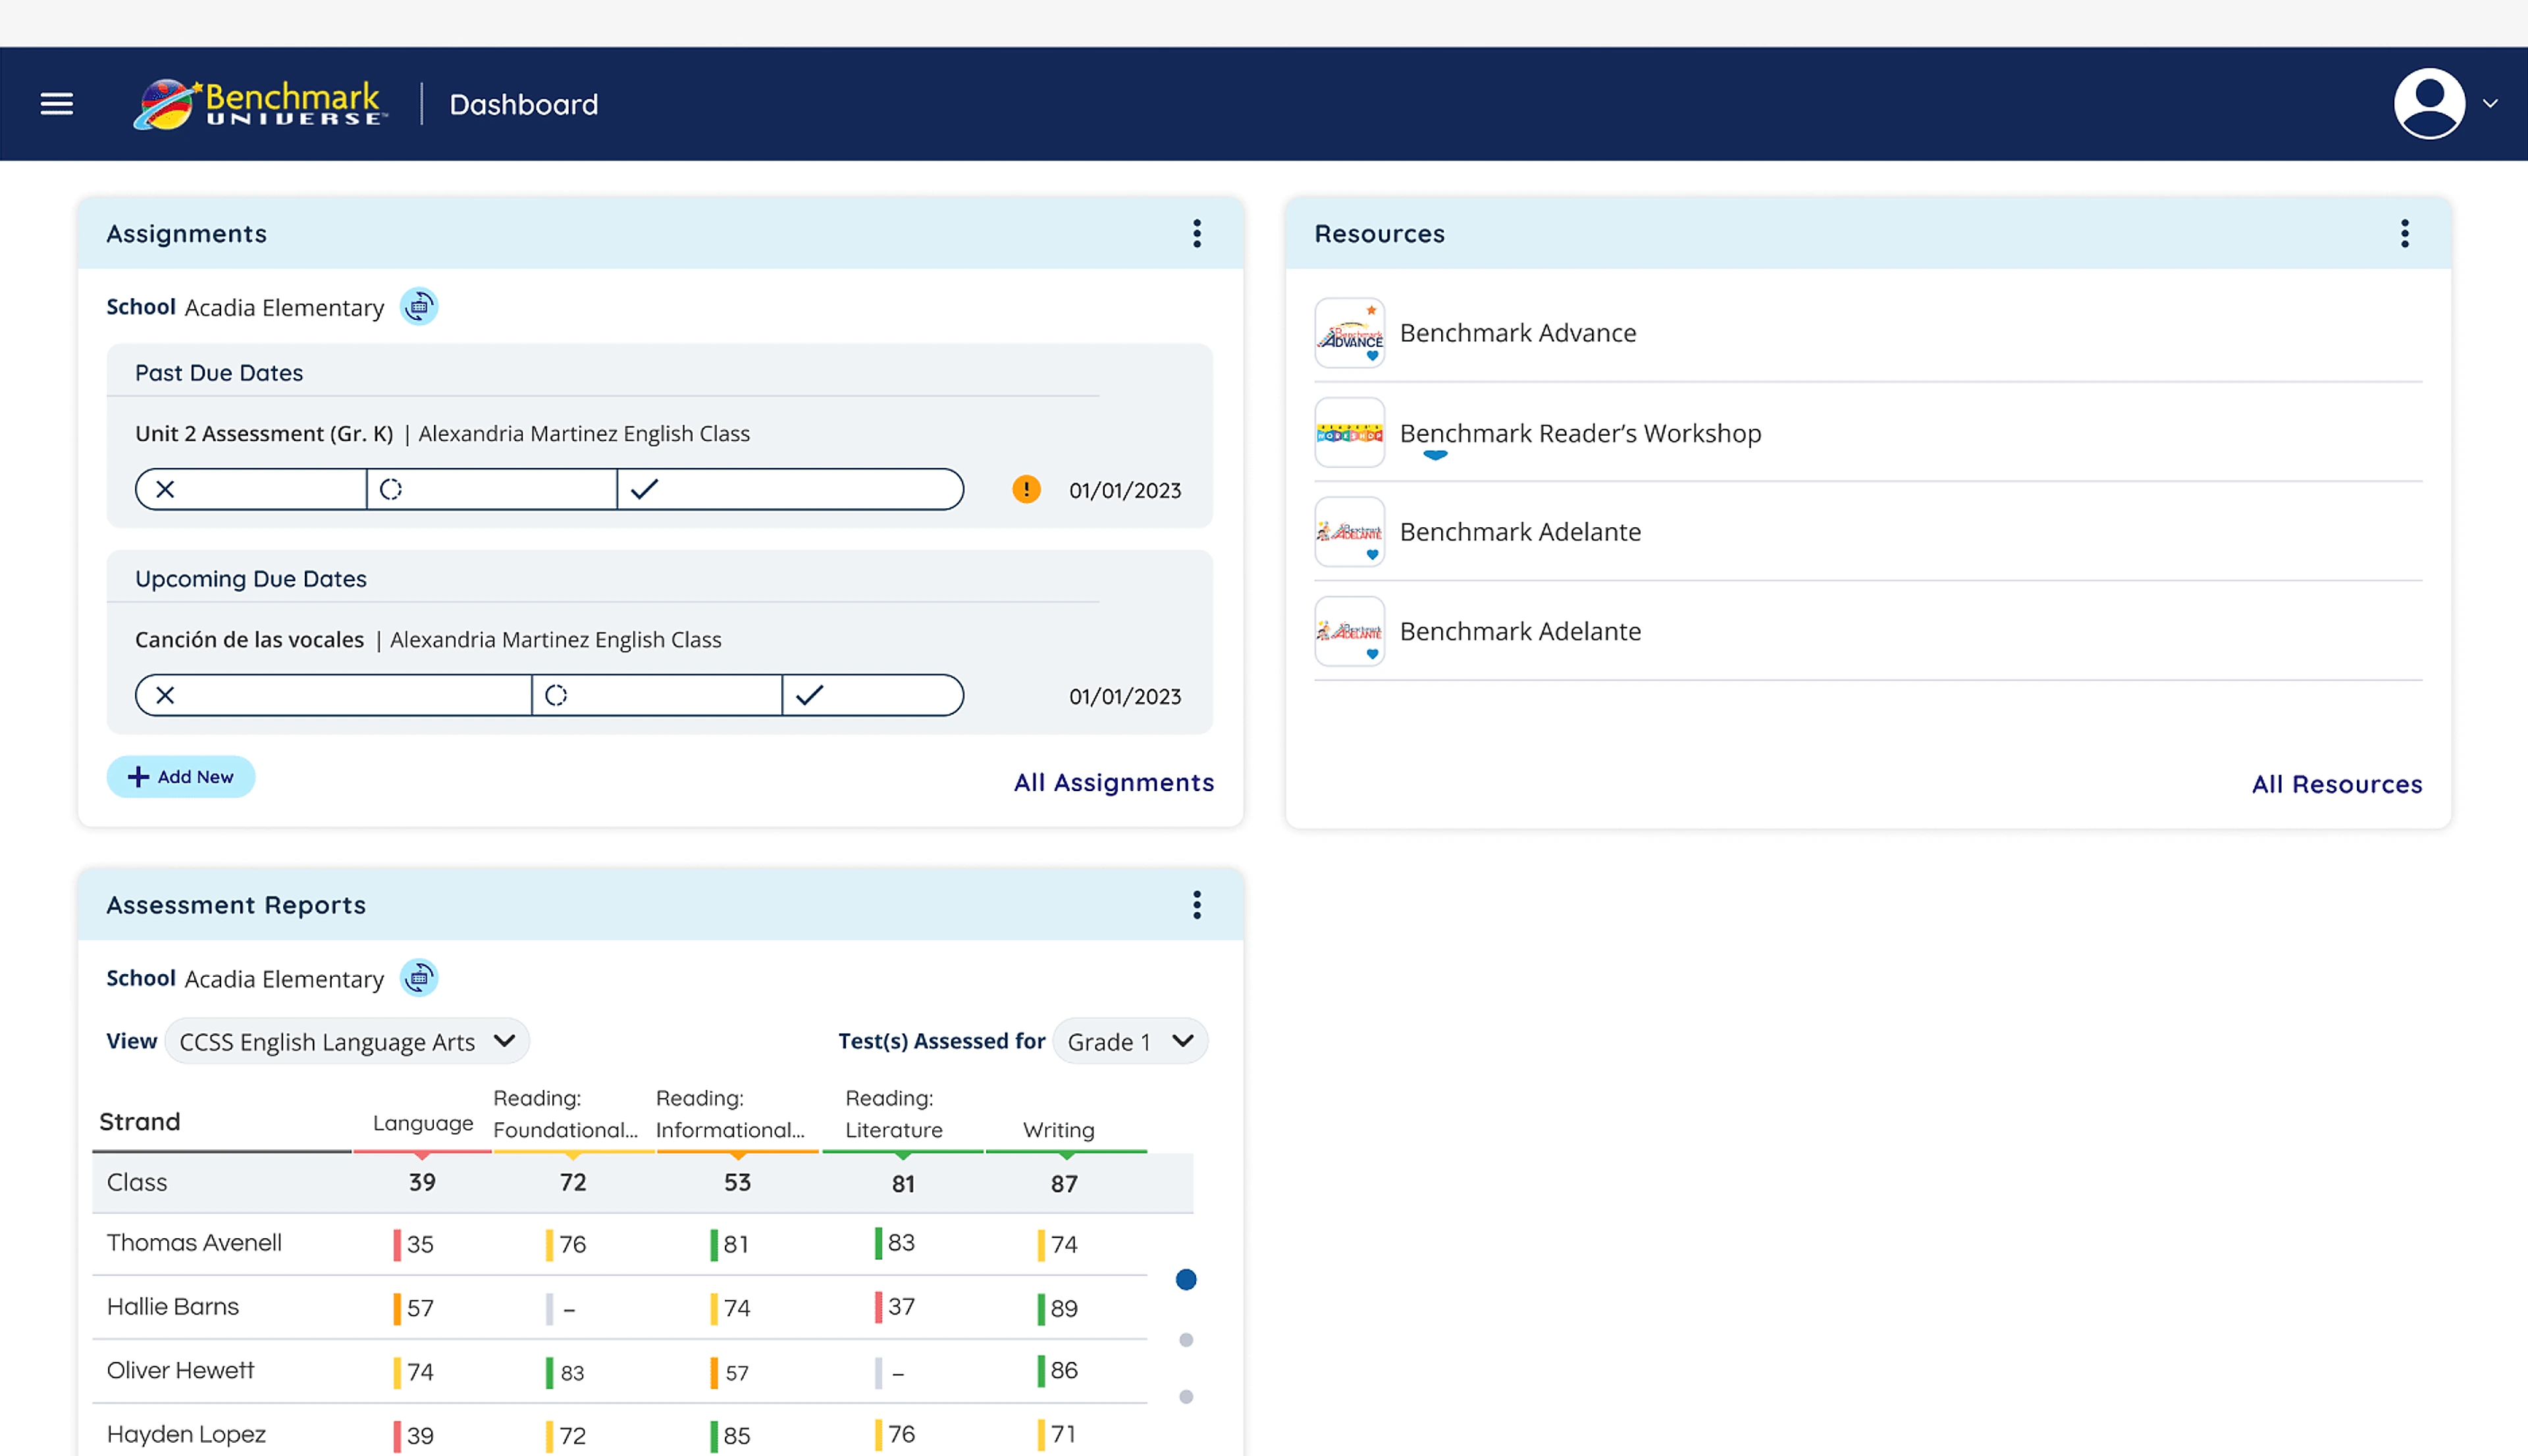
Improving classroom decision-making by turning a static directory into a customizable data experience for 120,000+ K–5 teachers.
Instead of forcing teachers to adapt their morning routine around a rigid software layout, BU Dashboard adapts around their grade level, curriculum focus, and student intervention needs.
End-to-end redesign of the core Benchmark Universe educator dashboard, including card-sorting IA for 17 tools, modular 8pt widget system, and slide-over customizer.
The Problems
Teachers interact with multiple tools daily — assignments, assessments, reports, and resources. However, the existing dashboard presented information in a fixed layout with limited prioritization, forcing teachers to:
- Navigate multiple sections to find important information
- Scan dense reports before identifying struggling students
- Adapt their workflow around the system rather than the system adapting to them
From a UX perspective, the dashboard lacked:
This created friction during critical moments such as morning lesson preparation or student intervention planning.
Designing for diverse classroom routines
A single static dashboard could never serve every educator. We architected a modular system tailored to four classroom variables.
Foundational phonics in K–1 vs. chapter book analysis in grades 3–5
Whole-class shared reading vs. small-group guided rotations
On-level enrichment vs. Tier 2/3 diagnostic intervention
Reporting cadences and standards benchmarking
End-to-End Product Discovery, IA & Widget System Craft
Synthesizing educator pain points and shadowing classroom morning prep routines.
Establishing task-focused frameworks and role-based presets.
Card-sorting studies to untangle 17 scattered tools into 3 intuitive pillars.
Prototyping the zero-friction side drawer and layout density toggles.
Formulating an 8pt responsive component anatomy across 1-col and 2-col spans.
Designing WCAG 2.1 AA compliant screens with optimal classroom projector contrast.
Authoring UI specifications, tokens, and conducting agile design QA.
CHAPTER 03 · MODULAR WIDGET ARCHITECTURE & CUSTOMIZER
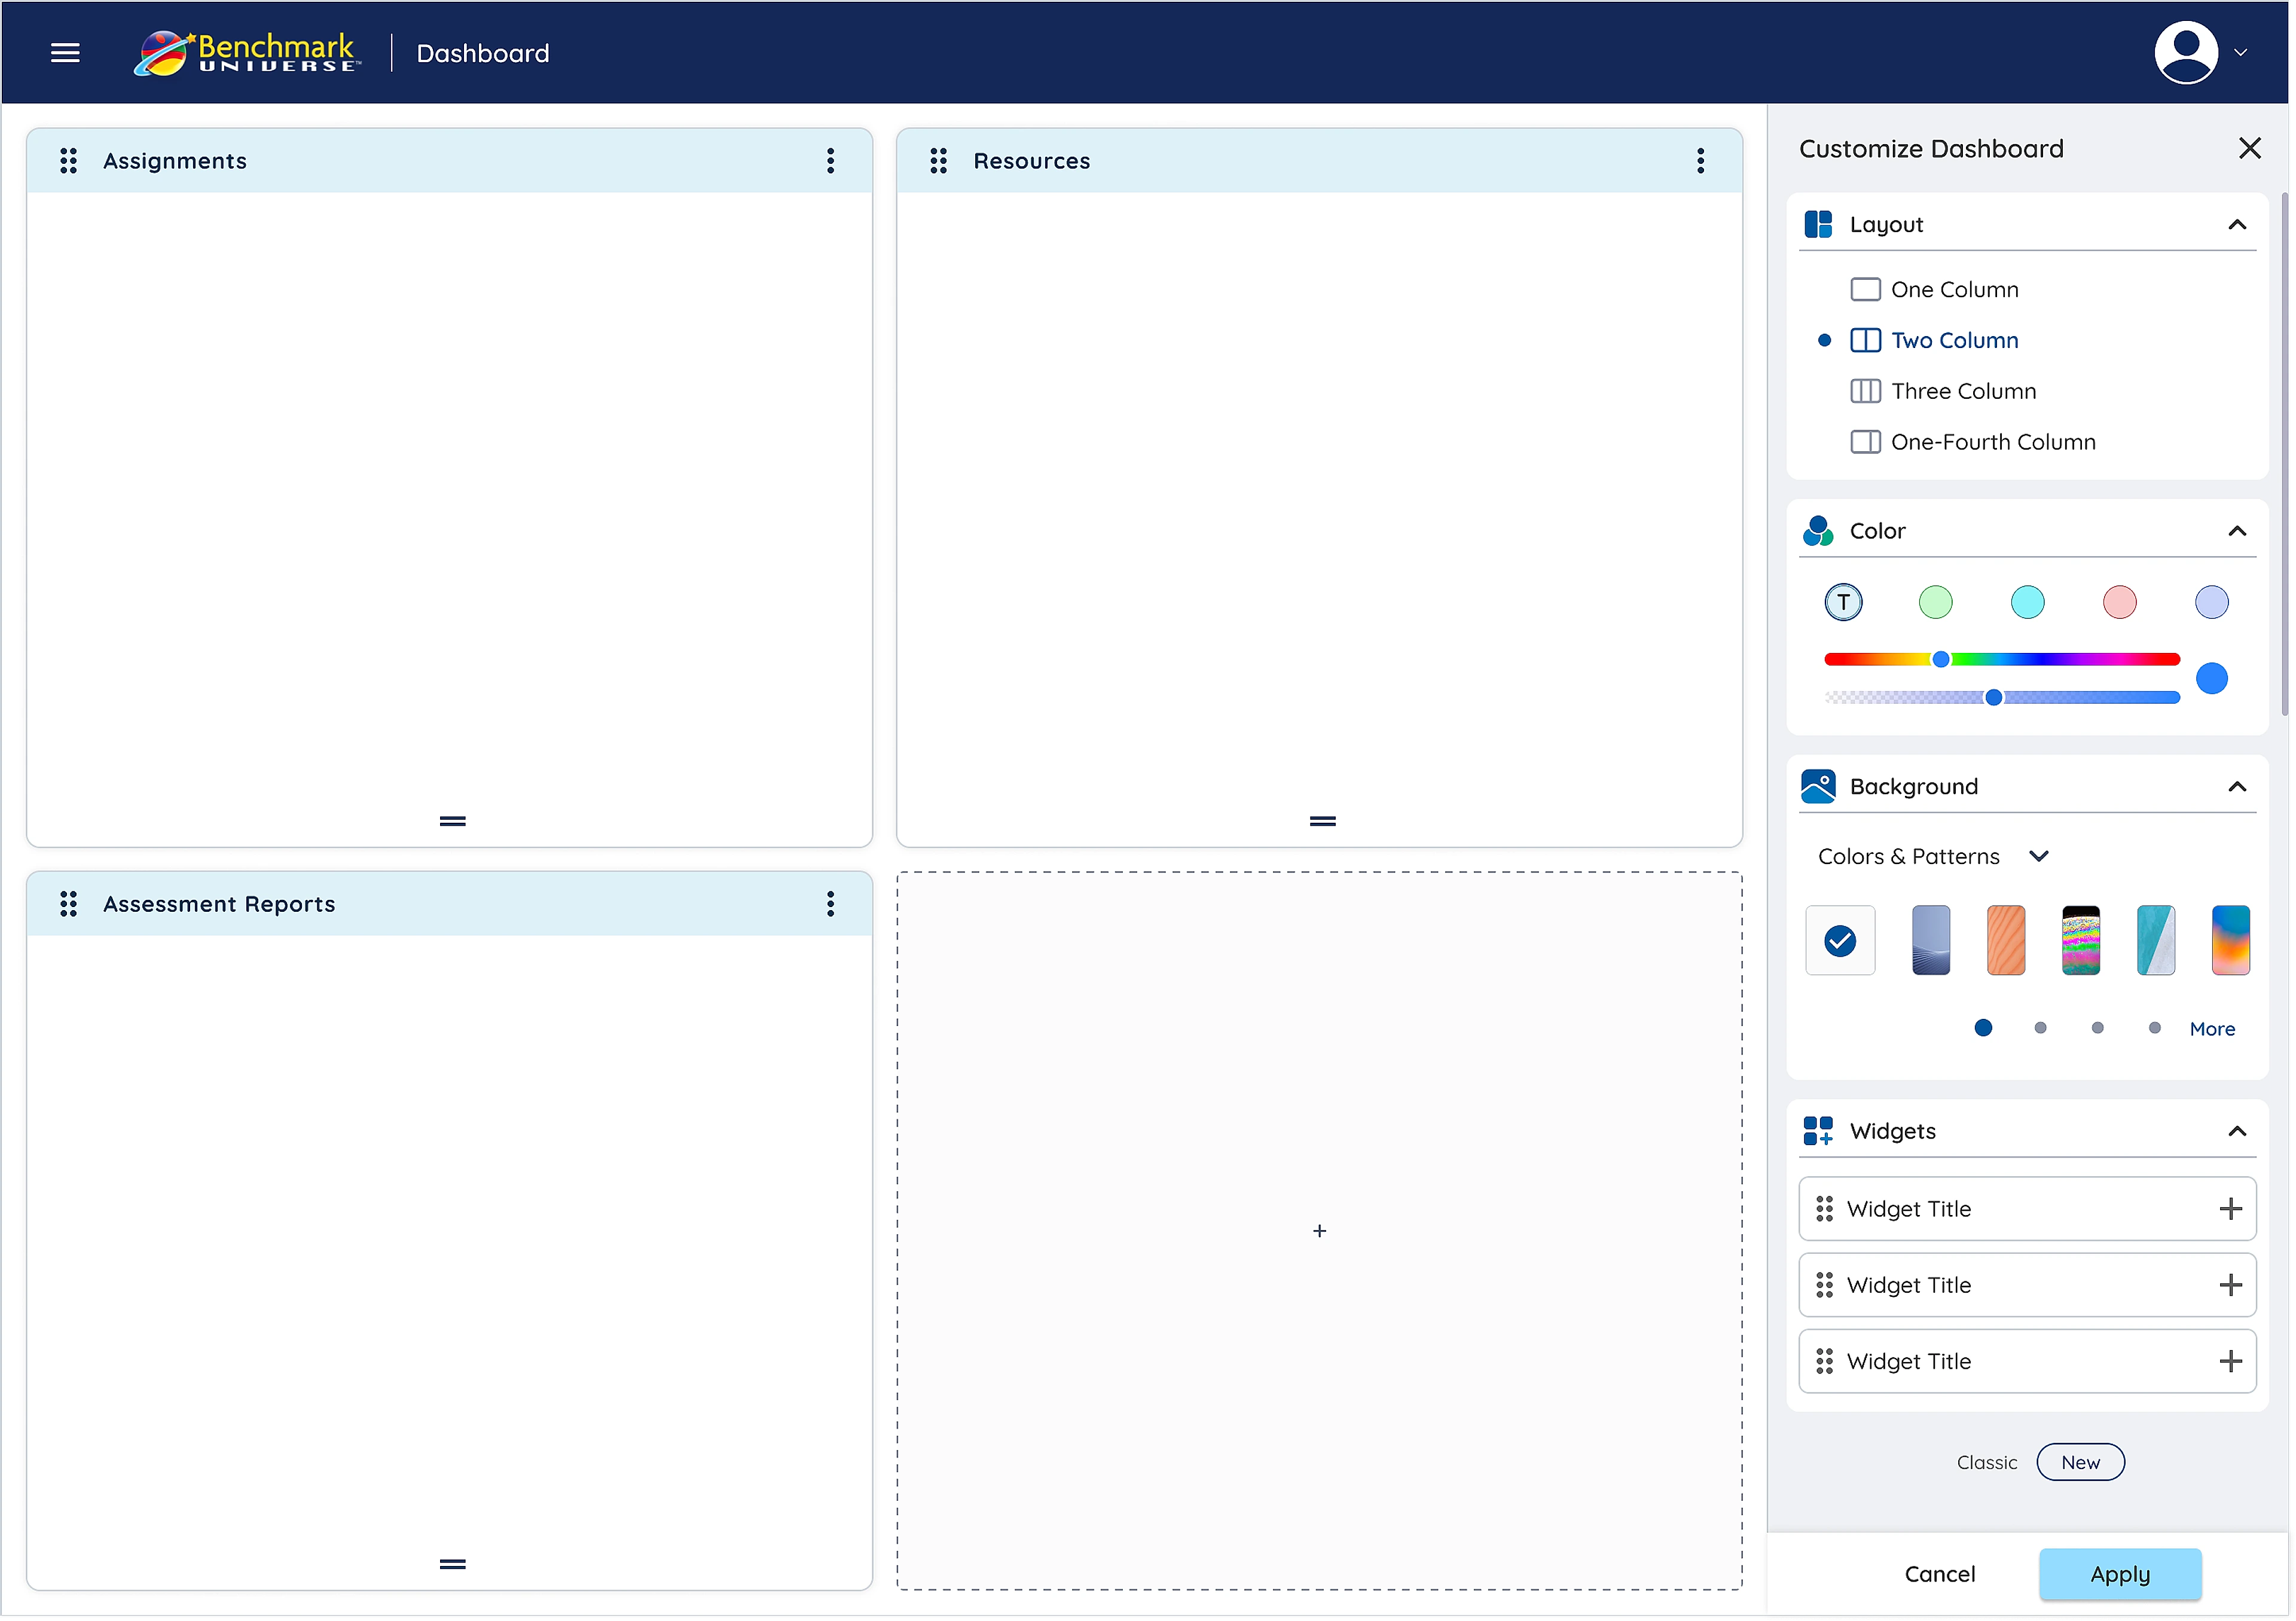
Homepage & Slide-Over Customizer
Each section became an independent widget card—paired with a right-hand slide drawer that lets educators adjust density, widgets, and themes without losing scroll context.
Assignments Widget
Pending student reviews, upcoming due dates, and 1-click grade submissions.
Resources Widget
Direct access to leveled e-books and smartboard-ready phonics decks.
Assessment Reports Widget
Real-time oral reading fluency curves, accuracy percentages, and at-risk alerts.
Zero-Context-Loss Workspace Personalization
Teachers can choose layout density (One, Two, Three, or One-Fourth Column), toggle widgets, and personalize themes with instant visual confirmation.
CHAPTER 04 · INFORMATION ARCHITECTURE · 3-PILLAR NAVIGATION
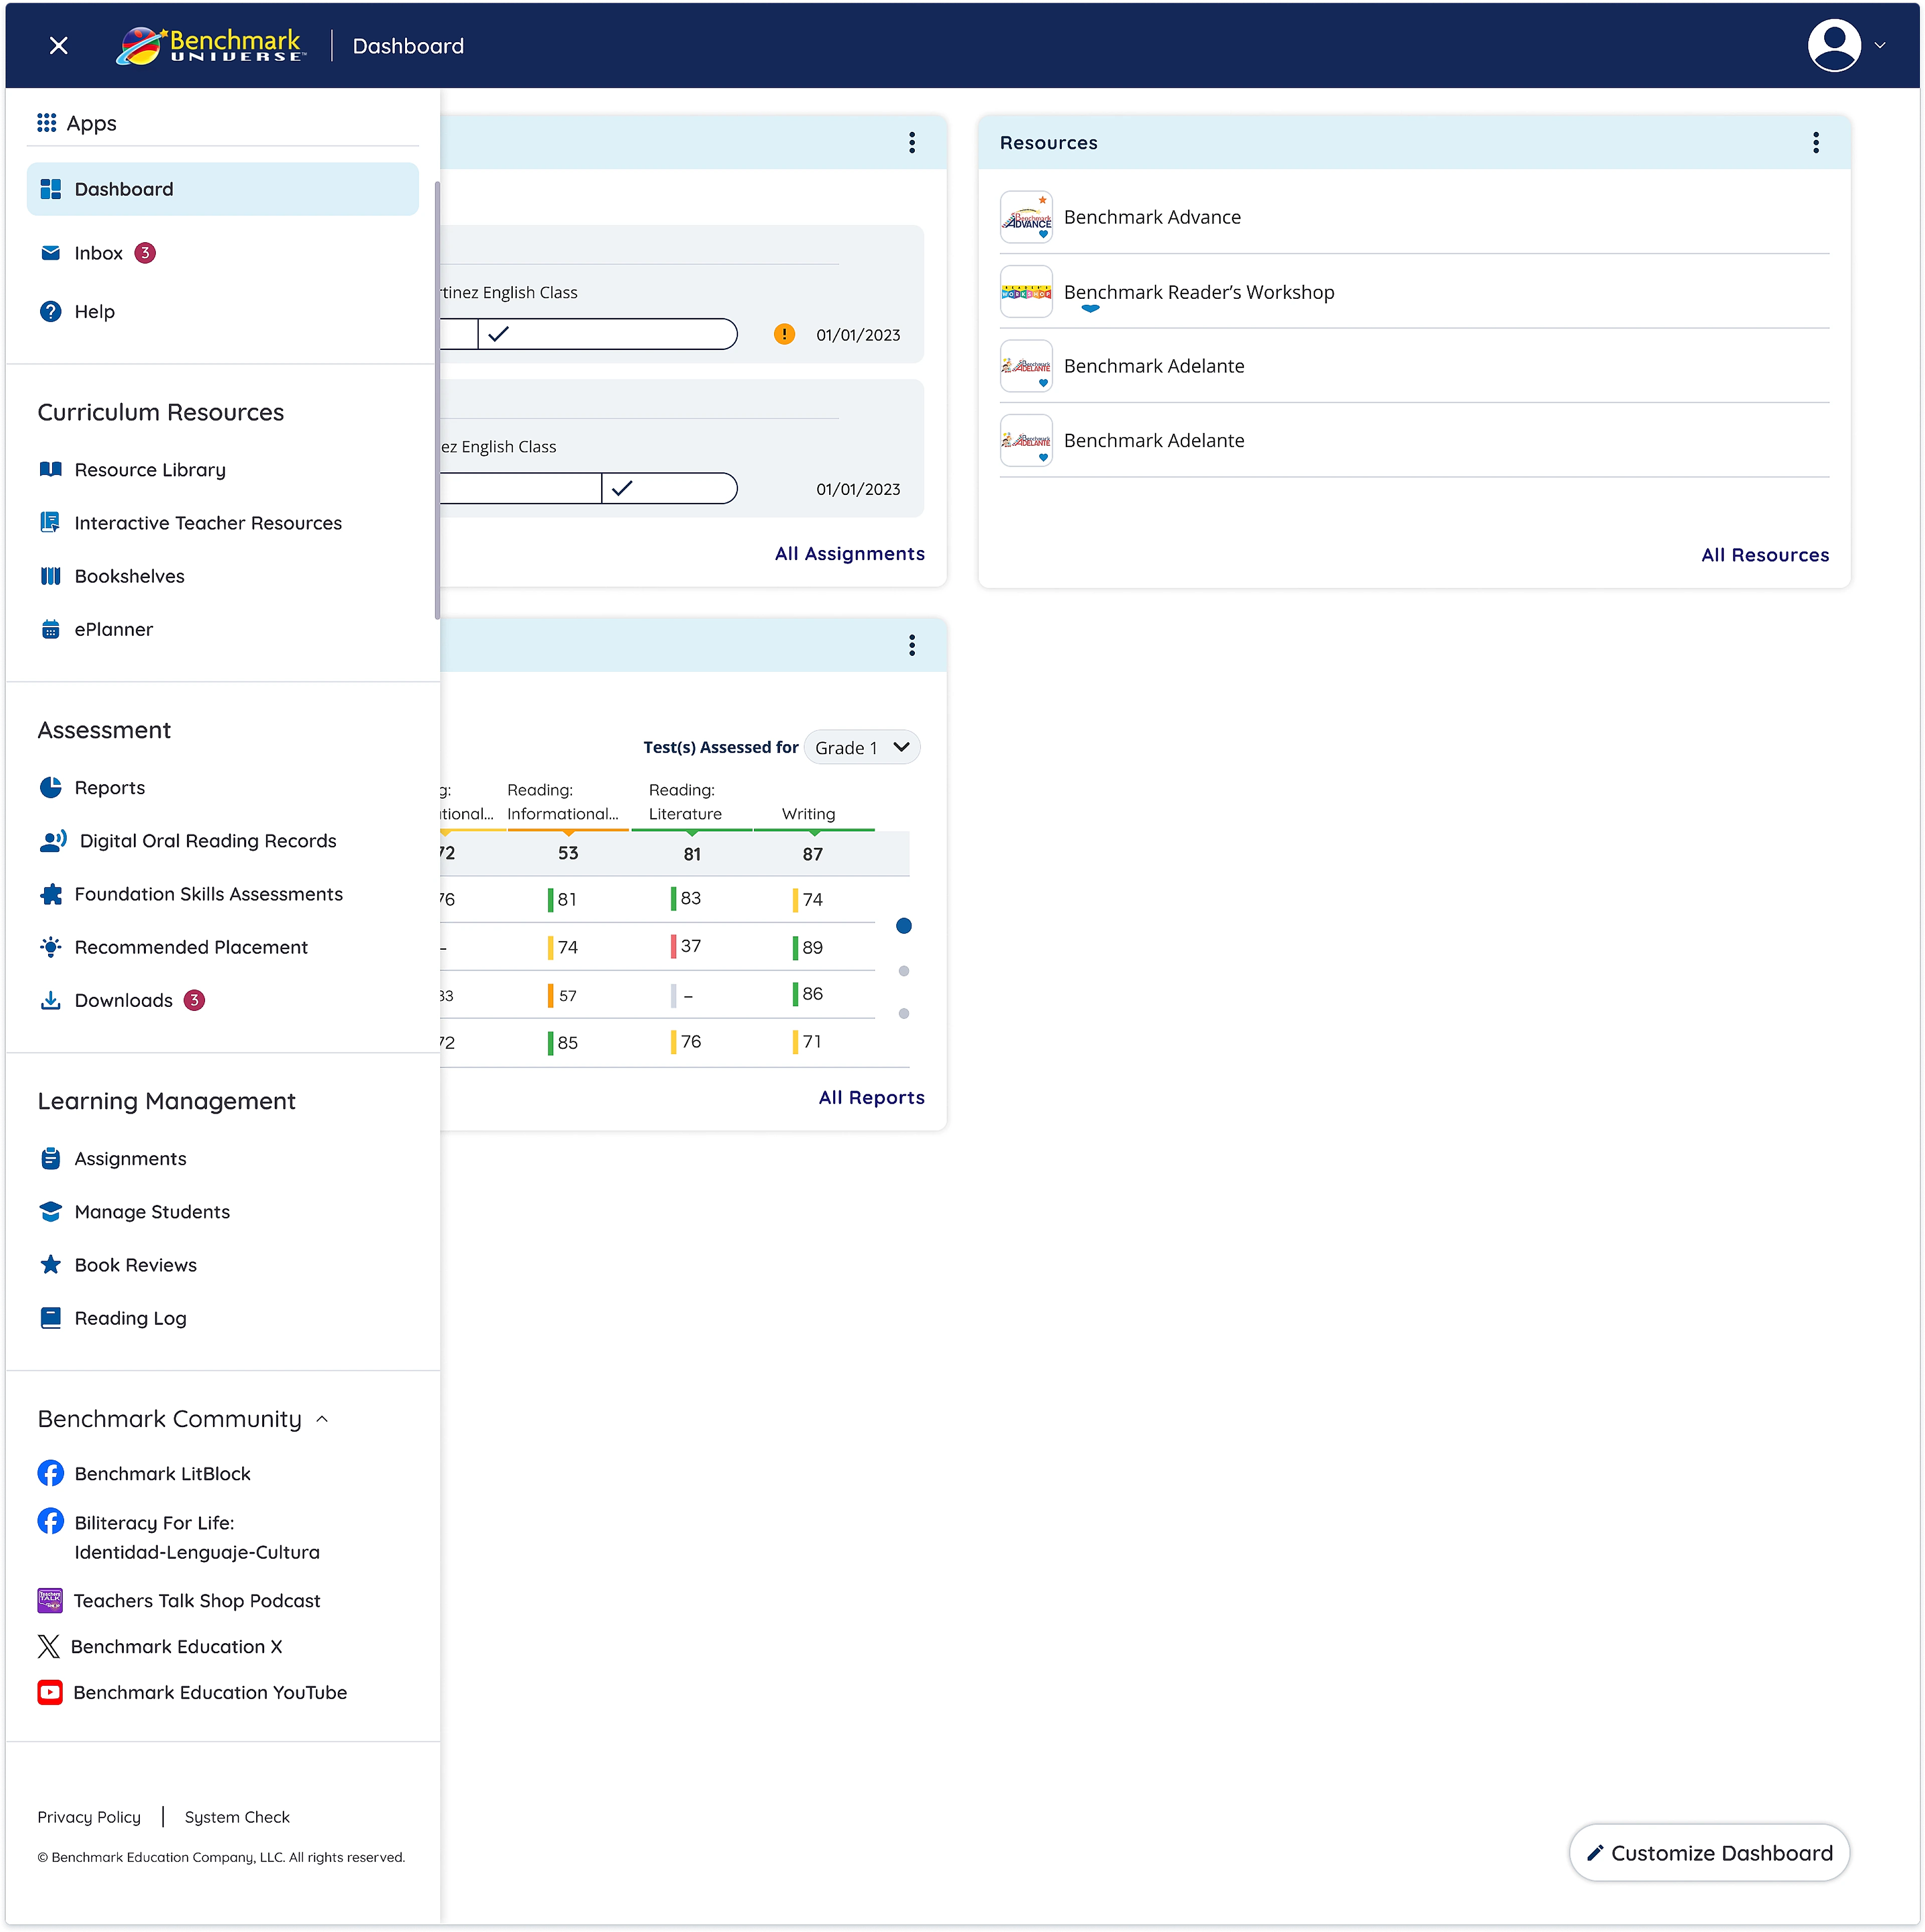
Untangling 17 scattered tools into 3 clear pillars
Card-sorting studies with K–5 teachers guided a clean 3-category hierarchy that eliminated 80% of unnecessary navigation hops.
- Resource Library
- Interactive Teacher Resources
- Bookshelves
- Reports
- Reading Records
- Placement Tools
- Assignments
- Manage Students
- Reading Logs
3-Pillar Navigation Menu
Grouping 17 scattered classroom tools into Curriculum Resources, Assessment, and Learning Management.
Impact
Rolled out to 120,000+ K–5 educators, the redesigned dashboard delivered measurable improvements in usability, daily workflow speed, and student support:
Daily Prep Time
Morning lesson preparation time dropped from 11.4 min to 6.6 min.
Usability Score
Jumped +23 points over the legacy 61 baseline in district usability testing.
Customizer Adoption
Teachers actively configured an average of 4 widgets within 30 days.
Faster Intervention
Struggling readers were identified and assigned support significantly earlier.
3 Key Lessons from Designing for 120,000+ Classrooms
The Paradox of Choice in EdTech
An empty customization screen overwhelms users. Introducing 3 opinionated role presets (Early Literacy, Intervention, Balanced) increased customization completion by 210%.
Designing for Classroom Interruption
Teachers operate in chaotic environments with frequent interruptions. Interfaces must provide instant undo mechanisms, large touch targets (min 48px), and zero ambiguous iconography.
Visual Data Improves Decision-Making
Prioritizing actionable flags over comprehensive data dumps empowers educators to spend less time analyzing software and more time teaching students.